What Was Climategate
On November 19th, 2009, 160 MB of compressed data was leaked from the University of East Anglia’s Climate Research Unit (CRU), a government funded program. Included were over a thousand emails and over three thousand documents including the source code used to generate the CRU’s climate models from the raw data. The leaked information did not include the raw temperature data itself.
In November of 2011 another leak of over 5000 CRU emails was also posted to internet servers. This is often referred to as Climategate II.
The CRU’s climate models are so important because they form the basis of the UN Climate Panel’s recommendations for implementing crippling carbon regulations on the developed economies of the world. These regulations and taxes, if implemented, would result in massive increases in the price of everything from electricity and gasoline to virtually every manufactured good. In short, life if general will get a whole lot more expensive for the average person if these recommendations get implemented. As such, it’s vital to be confident that the science underlying the recommendation is sound.
Included in the Climategate data dumps was sufficient information to conclude the following:
- Various questionable techniques and datasets were being used in the CRU’s models.
- Source code was written in such a way as to specifically weight and outright change data to achieve desired effects.
- There was an active conspiracy to prevent the raw temperature data from being released to outsiders. This included obstructing people issuing Freedom of Information Act requests for the data. Remember that the CRU was funded by the taxpayers.
- Ethically questionable steps were taken which did appear to subvert the scientific process. This included ensuring papers were peer-reviewed by only scientists known to be sympathetic to ‘the cause’ . Additionally, active steps where taken against anyone who dissented from CRU’s opinion including the editors of journals.
There’s way too much information to cover in one post so, for this post, let’s focus in on the first two topics: The datasets used and how that data was manipulated in the code.
Tree Rings as Proxy Data
Before we get into the nitty gritty it’s important to understand the role tree ring data played in Climategate.
It goes without saying that accurate temperature data is not available for anything except the last hundred years or so. For climate models to go further back in time so-called proxy data is used. Typically this involves using tree rings but may include ice core or other means to approximate historical temperatures. With tree rings the general premise is that the wider the ring for a given year, the warmer the temperature for that year. Or, at least that’s the theory.
The CRU used tree ring derived data to allow its models to graph hundreds and even thousands of years into the past to produce long-term historical graphs. These graphs thus mixed historical tree ring proxy data with modern instrumentation data.
There’s an obvious question here: How can we be sure that tree ring data is truly an accurate proxy for instrument data? And, if the answer is that tree ring data is not an accurate proxy, then clearly any models based on that assumption are undermined from the start.
The reality is that tree ring data can unequivocally NOT be trusted. This fact is well known in climate circles. It even has a name: The Divergence Problem.
The Divergence Problem
Wikipedia has a pretty good overview of the divergence problem but, in a nutshell here’s the bare bones:
When the instrumentation data (for which reliable data exists from about 1850 or so) is graphed against tree ring proxy data, there’s a major divergence that occurs starting around 1960. It looks like this:
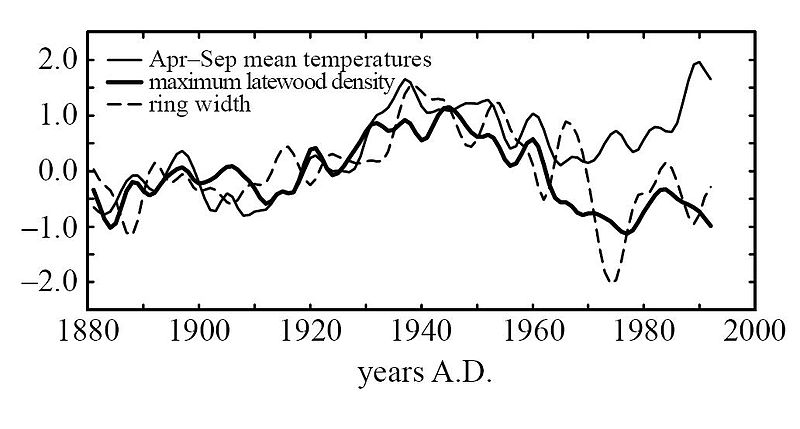
There are several theories about why this divergence has occurred but no consensus on the matter. It is known that, in addition to temperature, moisture and CO2 also affect ring width. It’s also likely that there are other variables affecting ring width that are not yet known.
The conclusion is obvious: It is provable that tree ring data is not a suitable proxy for temperature readings. Any climate model based on tree ring data is flawed from the start. Using historical tree rings to predict temperature doesn’t pass basic validation.
Making the Divergence Problem Disappear
The folks at CRU were well aware of the divergence problem and its affect on their models. After all, if only tree ring data was used, there didn’t appear to be any warming at all! This was not the conclusion they were looking for. Here’s email 3234 from the Climategate set which lays out the problem they were facing (emphasis mine):
Despite assurances from Ed and Keith, I must admit that I still don’t get it. The NRC committee is looking at a number of issues, but the one that is most publicly noted is to determine whether, and with what confidence, we can say that recent temperatures have emerged from the band of natural variability over the last millennium or two. Millennial reconstructions with high time resolution are mostly tree-ring based, mostly northern hemisphere, and as I understand it, some are correlated to mean-annual temperatures and others to seasonal temperatures. The performance of the tree-ring paleothermometry is central. Taking the recent instrumental record and the tree-ring record and joining them yields a dramatic picture, with rather high confidence that recent times are anomalously warm. Taking strictly the tree-ring record and omitting the instrumental record yields a less-dramatic picture and a lower confidence that the recent temperatures are anomalous. When a big difference is evident between recent and a millennium ago, small errors don’t matter; the more similar they are, the more important become possible small issues regarding CO2 fertilization, nitrogen fertilization (or ozone inhibition on the other side…).
Unless the “divergence problem” can be confidently ascribed to some cause that was not active a millennium ago, then the comparison between tree rings from a millennium ago and instrumental records from the last decades does not seem to be justified, and the confidence level in the anomalous nature of the recent warmth is lowered. This is further complicated by the possible small influence of CO2 fertilization…. I was just looking at some of the recent Mann et al. papers, and at the Osborn and Briffa paper from this year. In that one, as nearly as I can tell, there are 14 long records, of which 2 extend to 2000, 8 end in the early to mid 1990s, 1 in the early to mid 1980s, 2 in the early to mid 1970s, and one in the late 1940s. That looks to be a pretty small data set by the time you get into the strongest part of the instrumental warming. If some of the records, or some other records such as Rosanne’s new ones, show “divergence”, then I believe it casts doubt on the use of joined tree-ring/instrumental records, and I don’t believe that I have yet heard why this interpretation is wrong…
Clearly they had a real problem here. How could the divergence problem be resolved? Their answer: Just change the numbers.
And that’s exactly what they did. They changed the numbers.
I’ve just completed Mike’s Nature trick of adding in the real temps to each series for the last 20 years (ie from 1981 onwards) and from 1961 for Keith’s to hide the decline.
-Dr. Phil Jones, Director of CRU, Nov. 16, 1999Also we have applied a completely artificial adjustment to the data after 1960, so they look closer to observed temperatures than the tree-ring data actually were.
-Dr. Tim Osborn, CRU, Email Dec. 20, 2006Also, we set all post-1960 values to missing in the MXD data set (due to decline), and the method will infill these, estimating them from the real temperatures – another way of “correcting” for the decline, though may be not defensible!
-Dr. Tim Osborn, CRU, Email Oct 16, 2000
So all the scary hockey stick graphs used to terrorize the general public into believing we were on the precipice of impending doom were crap. CRU scientists messed with the numbers by mixing two very different sources of data (instrument and tree ring proxy) when the two datasets were clearly incompatible due to the divergence problem.
Was There Intent to Deceive
The question becomes whether the deceptive ‘trick’ to ‘hide the decline’ was done in good faith or not. Were the scientists at the CRU really trying to pull the wool over the public’s eyes?
In order to answer that question with certainty we need to understand:
- The exact transformation applied to the data to yield the published results.
- Whether the CRU team respected the peer-review scientific process and openly disclosed the transformations they applied to the data, and the logic behind those transformations. Stated another way, was there intent to obfuscate the truth?
Let’s turn our attention to the first question: How exactly was the data manipulated?
The Code
It all comes down to the software that was used to massage the raw data into the output that feed into the climate models. Fortunately, the Climategate release included the source code used to perform this transformation against the raw data.
I’m a software developer by trade and so I took a look myself at some of the Climategate code other researchers have called attention to. It is as bad as they say. What a mess.
First off, there’s some absolutely crazy regressions and transformations being applied. Many of these transformations might be legitimate. I’m not a climate scientist after all and there could be very good reasons for some of the manipulation that gets performed.
That said, consistently throughout the code there is clear evidence of:
- Fudge factors being used to achieve desired results when proper transformations fail.
- The divergence problem being specifically addressed by code treating data from before 1960 differently from data after 1960.
I don’t want to dump a whole bunch of source code on you so let me give you a selection of comments the programmers left embedded in the code. These comments give you an idea of the extent to which the data was mucked with. Most of these are taken from Jeffrey Smalls excellent ‘Climategate In Review‘:
“Plots 24 yearly maps of calibrated (PCR-infilled or not) MXD reconstructions of growing season temperatures. Uses “corrected” MXD – but shouldn’t usually plot past 1960 because these will be artificially adjusted to look closer to the real temperatures.”
“stop in 1960 to avoid the decline”
“stop in 1940 to avoid the decline”
“but why does the sum-of-squares parameter OpTotSq go negative?!!”
“and already I have that familiar Twilight Zone sensation.”
“this renders the station counts totally meaningless.”
“Oh yeah – there is no ‘supposed’, I can make it up. So I have :-)”
“As we can see, even I’m cocking it up!”
“yet another problem that’s based on the hopeless state of our databases”
“recent decline in tree-ring density has been ARTIFICIALLY REMOVED”
“Apply a VERY ARTIFICAL correction for decline!!”
“artificially removed (i.e. corrected) the decline”
“we know the file starts at yr 440, but we want nothing till 1400”
“It’s botch after botch after botch.”
“Oh, GOD, if I could start this project again and actually argue the case for junking the inherited program suite.”
“As far as I can see, this renders the [weather] station counts totally meaningless.”
“So what’s going on? I don’t see how the ‘final’ precip file can have been produced from the ‘final’ precipitation database, even though the dates imply that. The obvious conclusion is that the precip file must have been produced before 23 Dec 2003, and then redated (to match others?) in Jan 04.”
“You can’t imagine what this has cost me — to actually allow the operator to assign false WMO [World Meteorological Organization] codes!! But what else is there in such situations? Especially when dealing with a ‘Master’ database of dubious provenance …”
“OH F— THIS. It’s Sunday evening, I’ve worked all weekend, and just when I thought it was done, I’m hitting yet another problem that’s based on the hopeless state of our databases.”
The above comments should give you a good flavour for how thoroughly the data was corrupted and manipulated. But the absolute smoking gun is the code itself. Let me give you one concrete example. If you take nothing else away from this post, understand the implications of the following:
;
; Apply a VERY ARTIFICAL correction for decline!!
;
yrloc=[1400,findgen(19)*5.+1904]
valadj =[0.,0.,0.,0.,0.,-0.1,-0.25,-0.3,0.,-0.1,0.3,0.8,1.2,1.7,2.5,2.6,2.6, 2.6,2.6,2.6]*0.75 ; fudge factor
if n_elements(yrloc) ne n_elements(valadj) then message,’Oooops!’
yearlyadj=interpol(valadj,yrloc,timey)
This code is essentially specifying a series of adjustments applied to the input data by blocks of years. As you can see from the series, initially data undergoes no adjustment. Then, towards the beginning of the sequence, the data is adjusted down. As we get to the middle and end of the series the data is adjusted up by progressively increasing amounts.
The end result: If the raw input data was completely flat, you’d still wind up with a curve that looked like this:
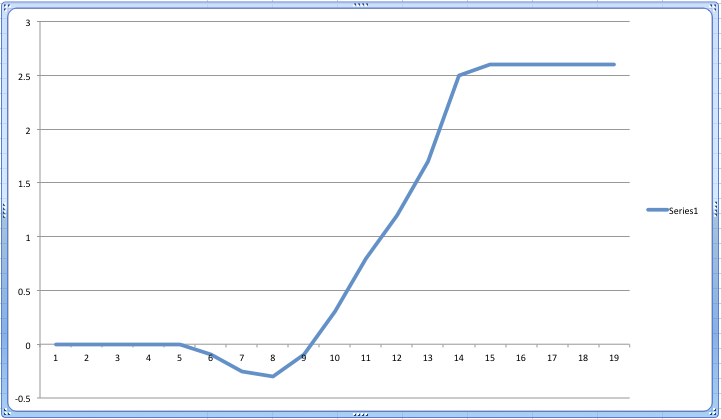
And that, my friends, is how you take any data series and produce a scary looking ‘hockey stick’ chart. By weighting early data negatively and later data increasing positively, you produce a completely artificial slope exactly like the one CRU produced to convince everyone that climate change was real.
Conclusion
I’ve shown how the use of tree ring proxy data lays at the heart of the infamous hockey stick graph used to convince everyone that the climate was undergoing unprecedented warming. I’ve also shown how that tree ring data is provably not a good proxy of temperature.
Emails from the scientists at the CRU show they were fully aware of the divergence problem and took active steps to mask it in their models. Ultimately these steps were expressed in the source code which was littered with special fudge factors and transformations to force the data to produce a desired result.
But the question still remains: Was the deception intentional? Was there a conspiracy to hide the manipulations used and mislead the scientific community and the public at large? The answer to this question rests on whether the CRU was open and transparent in its operation and embraced the peer-review scientific method. This is what I’ll focus on in my next post. Stay tuned…
You may also like:
- Climategate Part Three: What Does the Data Really Show?
A look at the raw instrument temperature data since 1850 establishes that some global warming is occurring. Investigating further into our planet’s climate history places this warming into the appropriate context.
There is a pressing need to question the conclusion of global warming and cast a critical eye on the policies that are being put in place on the basis of perhaps the greatest con in human history.
- Climategate Part Two: The Undermining of the Scientific Method
The scientists involved in Climategate knew their conclusions were based on faulty data and a rigged climate model. These scientists engaged in a systematic and coordinated campaign to prevent their data and model methodologies from being made known. This campaign extended to blatant obstruction of Freedom of Information Act requests. Worst of all, these global warming advocates assaulted the core principals of the scientific method by attacking the peer-review process itself. By pressuring journals and editors to publish papers supporting the ’cause’ while blocking publication of ‘dissenting’ papers, proper scientific debate, the means by which we arrive at the truth, was quashed.